
Recognition, Assessment, and Gestational Management
The Heart Is Not the Disease: It Is the Victim
High cardiac output in the fetus is not a diagnosis. It is a physiological state with a cause, a trajectory, and a window of action. All causes share the same mechanism: an additional low-resistance vascular pathway forces the fetal heart to generate far more output than it was built to sustain.
The fetal myocardium operates near maximum sarcomere length at baseline, has limited Frank-Starling reserve, and depends heavily on heart rate as its primary compensatory tool. When that reserve is exhausted, the transition from compensation to decompensation can be abrupt.
Causes of Fetal High Cardiac Output
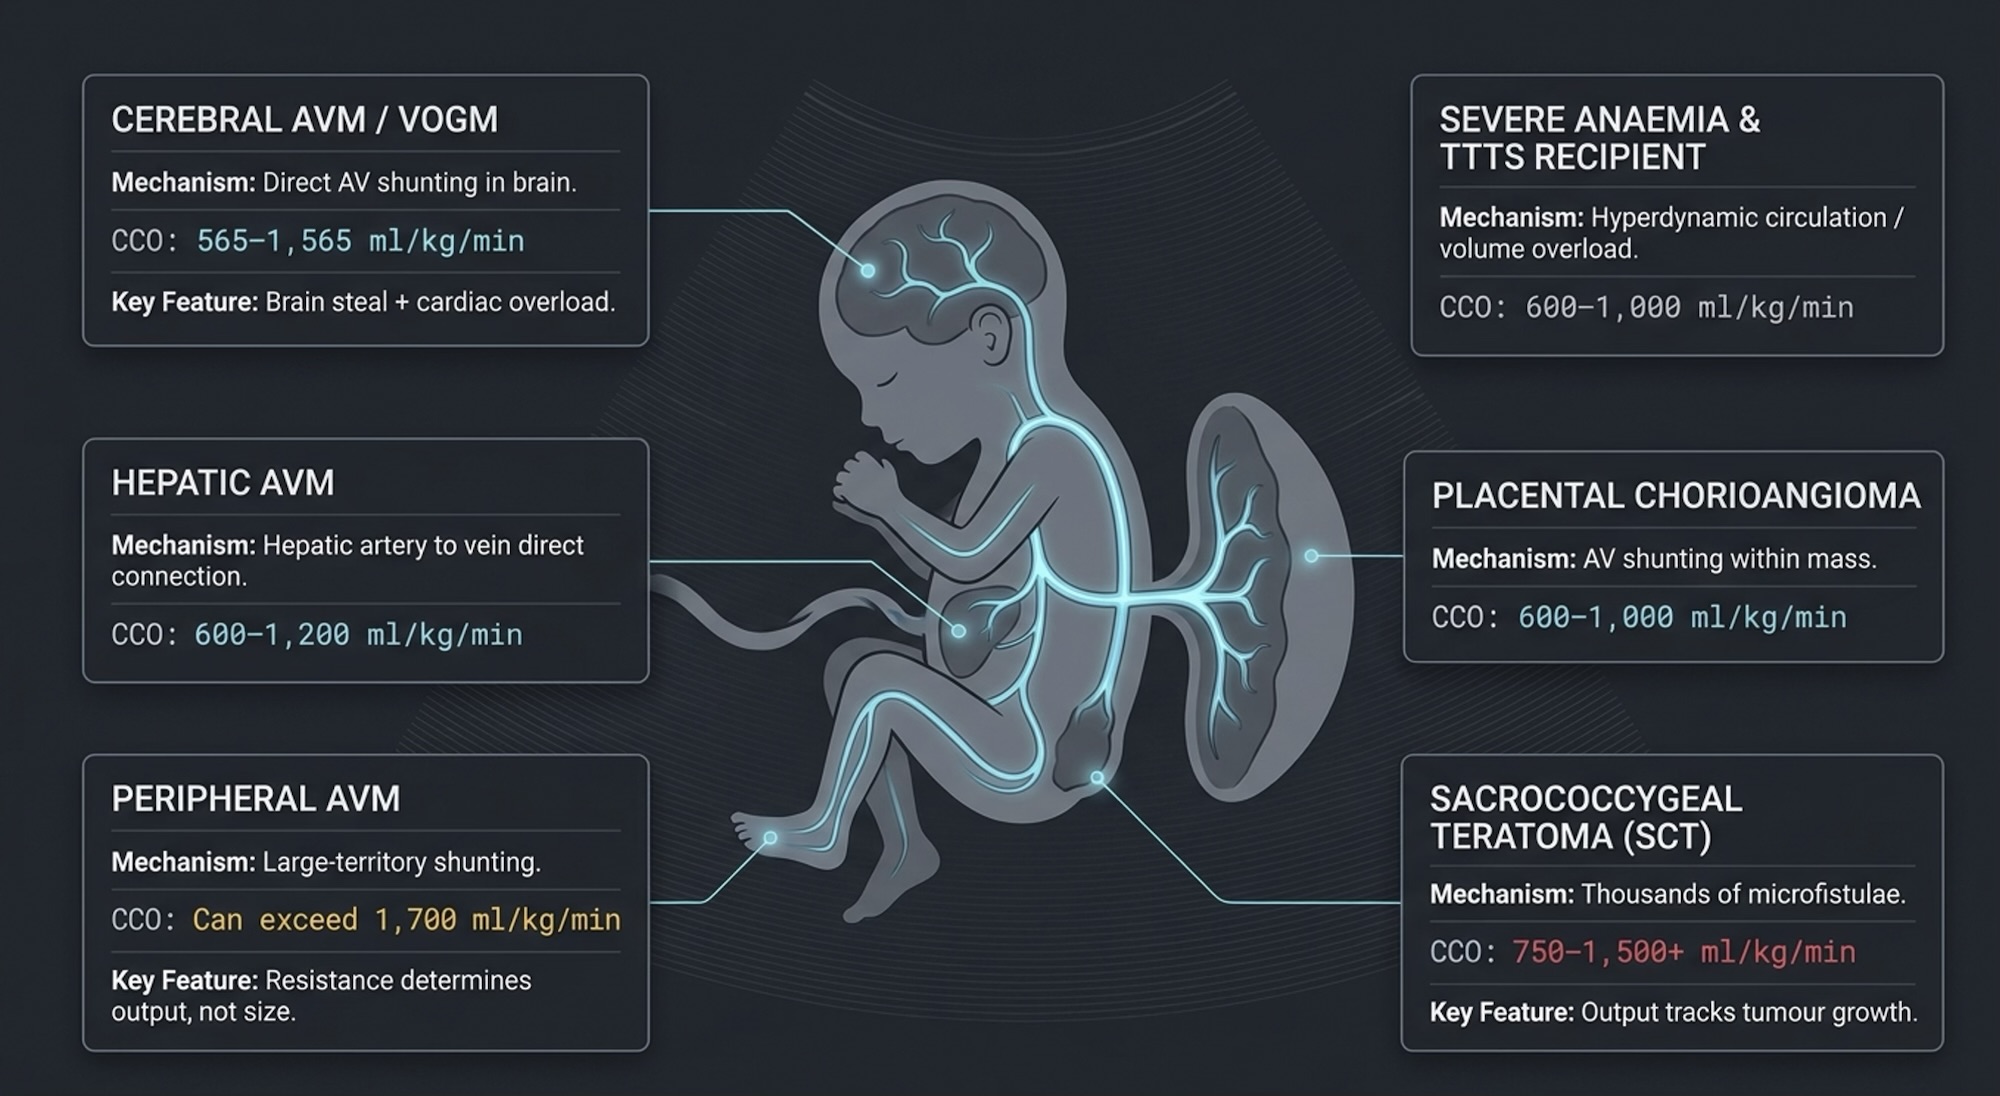
The table below summarises the major causes with their indexed CCO ranges and key distinguishing features. The three conditions discussed in detail later — AV malformation, sacrococcygeal teratoma, and placental chorioangioma — account for the majority of cases encountered in clinical practice.
| Cause | Mechanism | Typical CCO (indexed) | Key Features |
|---|---|---|---|
| Cerebral AVM / VOGM | Direct AV shunting in brain | 565–1,565 ml/kg/min | Brain steal + cardiac overload; high-velocity low-resistance MCA flow |
| Hepatic AVM | Hepatic artery to hepatic vein direct connection | 600–1,200 ml/kg/min | Enlarged hepatic artery on Doppler; liver often enlarged |
| Peripheral AVM | Large-territory AV shunting — often entire limb segment | Can exceed 1,700 ml/kg/min | Resistance determines output, not lesion size |
| Sacrococcygeal teratoma | Thousands of microfistulae within tumour mass | 750–1,500+ ml/kg/min | Output tracks tumour growth week to week |
| Placental chorioangioma | AV shunting within placental mass | 600–1,000 ml/kg/min | Resolves at birth with placental delivery |
| Severe fetal anaemia | Compensatory hyperdynamic circulation | 600–900 ml/kg/min | MCA PSV >>1.5 MoM; CCO normalises with IUT |
| TTTS recipient twin | Volume overload from inter-twin transfusion | 600–1,000 ml/kg/min | Polyhydramnios; laser treatment addresses cause |
CCO Thresholds : What the Numbers Mean
The following thresholds apply at 32 weeks gestation as a reference point. For other gestational ages, use indexed values (ml/kg/min) which remain stable across gestation.
| CCO at 32 weeks | Indexed (~2.8 kg) | Interpretation | Clinical State |
| ~950 ml/min | ~340 ml/kg/min | Normal | Not a high-output state |
| 1,200–1,800 ml/min | ~430–640 ml/kg/min | Mildly elevated | Compensated; monitor closely |
| 1,800–3,000 ml/min | ~640–1,070 ml/kg/min | Significantly elevated | Active compensation; twice weekly echo |
| 3,000–4,000 ml/min | ~1,070–1,430 ml/kg/min | Severely elevated | Myocardial fatigue expected |
| >>4,000 ml/min | >>1,430 ml/kg/min | Extreme | Structural remodelling; narrow margin |
| ~4,900 ml/min | ~1,750 ml/kg/min | ~5× normal | Annular dilatation + elevated VTI both present |
| THE DANGER THRESHOLD Most published series identify indexed CCO above 750–800 ml/kg/min as the zone where cardiovascular instability, hydrops, and in-utero demise risk increases significantly. Above this level, the probability of decompensation climbs steeply. |

Fig 2. Indexed CCO zones from normal (~340 ml/kg/min) through mildly elevated, significantly elevated, severely elevated, to extreme (>>1,430 ml/kg/min). Danger threshold marked at 750–800 ml/kg/min.
The Three Most Common High-Output Conditions
AV malformations, sacrococcygeal teratoma, and placental chorioangioma share the same haemodynamic mechanism but differ substantially in shunt architecture, output trajectory, monitoring approach, and postnatal management. Understanding these differences changes how you watch each condition at the bedside.
| Feature | AV Malformation | Sacrococcygeal Teratoma (SCT) | Placental Chorioangioma |
| Shunt architecture | One or few large direct AV fistulae, high flow per fistula | Thousands of microfistulae throughout tumour — high aggregate flow | Multiple vascular channels within placental mass |
| Output determinant | Shunt resistance, not lesion size. Small AVM with low resistance can generate extreme CCO. | Tumour size and vascularity, grows proportionally with tumour | Lesion size and vascularity, Doppler vascularity index correlates with shunt |
| Typical CCO range | 565–1,565 ml/kg/min cerebral; peripheral can exceed 1,700 | 750–1,500+ ml/kg/min; mean 1,280 with hydrops | 600–1,000 ml/kg/min |
| Speed of deterioration | Can be abrupt, resistance may drop suddenly without warning | Gradual, tracks tumour growth week to week | Moderate, correlates with lesion growth rate |
| Monitoring surrogate | VTI trend + DV A-wave + HR trend | Tumour vascularity index + CCO + DV waveform | Lesion size + CCO + DV + MCA PSV if anaemia suspected |
| Postnatal crisis risk | High: AVM persists after delivery; placental buffer removed at cord cut | Moderate: tumour removed at surgery; function recovers if not already failed | Low: placenta delivered; shunt source removed at birth |
| Postnatal intervention | Embolisation (cerebral) or surgical ligation (peripheral) | Surgical resection- urgent if cardiac failure; elective if stable | None required- resolves with placental delivery |
| Fetal intervention | Not routinely available antenatally | Interstitial laser / open fetal surgery at specialist centres | Feeding vessel laser / alcohol ablation in severe cases |
| Genetics | RASA1, EPHB4 (CM-AVM); ENG, ACVRL1 (HHT) -autosomal dominant; take family history | Mostly sporadic; Currarino triad association | Sporadic; no known genetic association |
| THE KEY DISTINGUISHING PRINCIPLE In AVM; output is driven by resistance, not size. In SCT; output tracks tumour bulk. In chorioangioma, the shunt resolves at birth. The postnatal prognosis is therefore fundamentally different across these three conditions even when the antenatal CCO appears similar. |
The Shunt Fraction – Making the Burden Visible
In any high-output state, the extra cardiac output above normal is going entirely into the shunt. Expressing this as a fraction of total output makes the physiological burden immediately intuitive.
| SHUNT FRACTION FORMULA Shunt Fraction = (Actual CCO – Expected CCO for gestation) ÷ Actual CCO |

Fig 3. Visual representation of shunt fraction concept.
Example at 32 weeks: If Actual CCO = 4,900 ml/min · Expected CCO = 950 ml/min Shunt Fraction = (4,900 – 950) ÷ 4,900 = 80%
This means 80% of cardiac output is going into the AVM. Only 20% reaches the brain, kidneys, gut, and placenta.
Shunt fraction >>50% = significant redistribution Shunt fraction >>70% = critical, regardless of DV or hydrops status
Echo Parameters to Track – In Priority Order
No single parameter makes the management decision. The decision is made by watching multiple parameters move in the same direction, over time, in the context of gestational age.
| Priority | Parameter | What to Track | Danger Signal |
| 1 | Ductus venosus A-wave | Forward → absent → reversed | Any reversal = right heart pressure critical |
| 2 | Biventricular VTI trend | Rising or stable vs falling | Falling VTI = decompensation, not improvement |
| 3 | Fetal heart rate trend | Was it higher before? Is it now falling? | Rate falling in high-output state = chronotropic fatigue |
| 4 | MPI (Tei index) | Serial values- is it rising? | MPI >>0.58–0.65 = significant myocardial inefficiency |
| 5 | Serous effusions | Pericardial → pleural → ascites sequence | Ascites = overt hydrops; delivery discussion |
| 6 | CTR (cardiothoracic ratio) | Serial measurements, direction of change | CTR >>0.50 = cardiomegaly; >>0.55 = reserve exhausted |
| 7 | CCO absolute value | Calculate formally at each visit; track direction | CCO >>3× normal for gestation = severely elevated load |
| 8 | UV pulsatility | Present or absent | Any pulsatility = transmitted right heart failure; late sign |
| THE VTI PARADOX A VTI that was previously elevated and begins to fall might seem reassuring, as if the heart is doing less work. This interpretation is wrong. A falling VTI in a previously high-output fetus means the heart can no longer sustain the elevated output. Treat a downward VTI trend as a decompensation signal, never as improvement. |
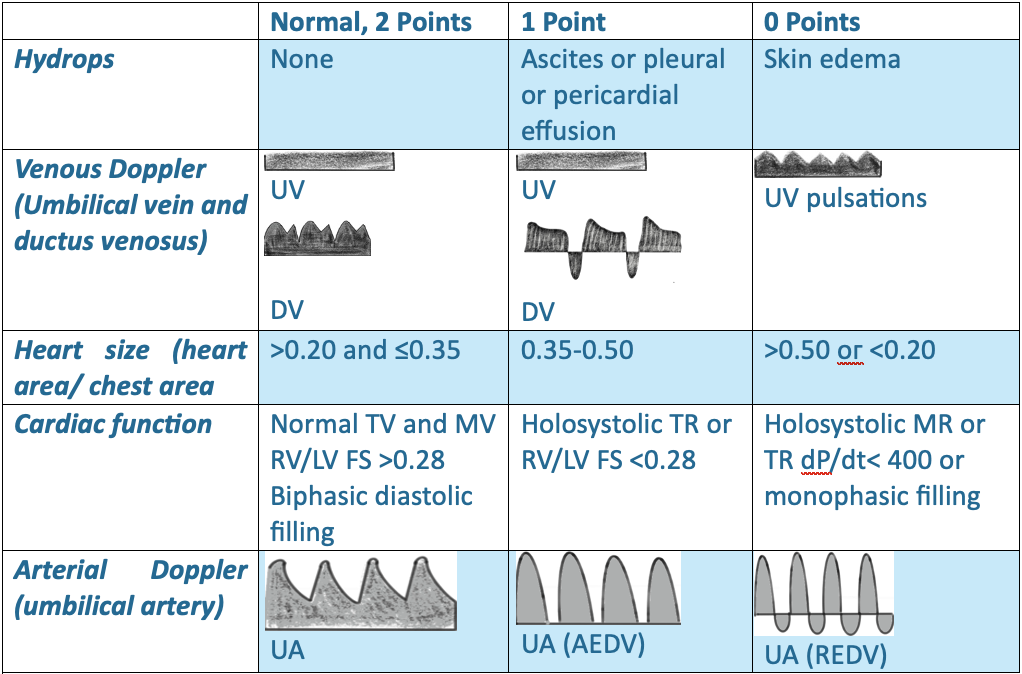
The Cardiovascular Profile Score (CVPS)
The CVPS provides a structured single-number summary of fetal cardiac compromise across five domains, each scored 0–2. Maximum score 10 = normal. Minimum score 0 = moribund.
| CVPS | Interpretation | Recommended Action |
| 10 | Normal | Routine monitoring per underlying condition |
| 8–9 | Mild compromise | Increase surveillance frequency |
| 6–7 | Moderate compromise | Twice weekly minimum; delivery planning discussion |
| 4–5 | Severe compromise | Inpatient monitoring; imminent delivery planning |
| ≤3 | Critical | Deliver immediately if viable |
| CVPS LIMITATION IN HIGH-OUTPUT STATES CVPS was developed for immune and non-immune hydrops, not specifically for high-output states. In high-output physiology, the heart size domain drops first (cardiomegaly appears early) while venous Doppler holds longer because placental buffering delays the right heart pressure rise. The score can therefore underestimate risk. Always interpret CVPS alongside absolute CCO: the score tells you where the fetus is on the map; CCO tells you how fast it is moving toward the edge. |

Fig 4. Heart size (CTR, orange) drops early in the course of high-output cardiac failure. Venous Doppler DV (teal) holds near normal for a prolonged period due to placental buffering, then drops sharply to reversed. The dissociation between these two domains explains why CVPS can underestimate risk.
Monitoring Framework by Gestational Age
The same echo findings carry different weight and demand different responses depending on gestational age. The following framework sets out the clinical priorities, monitoring intervals, and delivery thresholds for each gestational band.
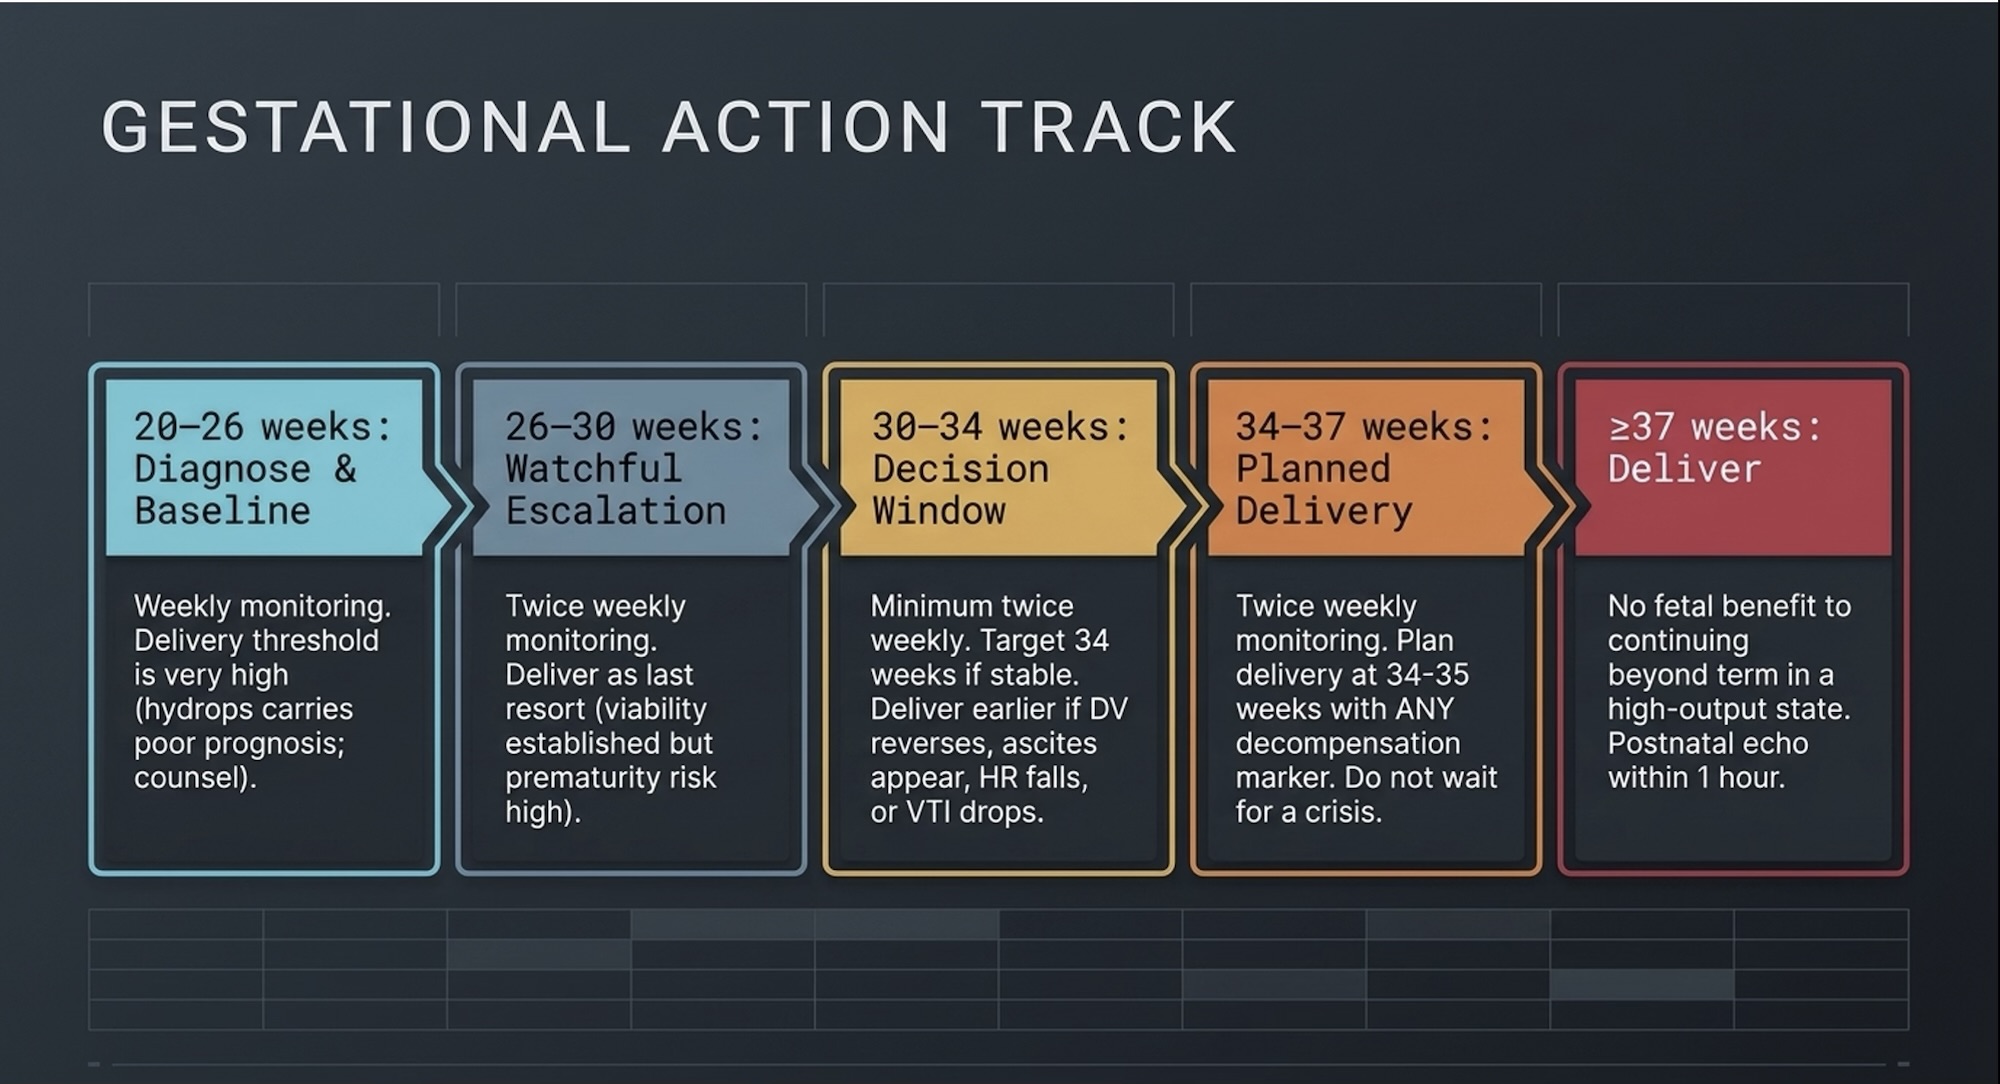
Fig 5. Sequential gestational bands: 20–26 weeks (Diagnose & Baseline) → 26–30 weeks (Watchful Escalation) → 30–34 weeks (Decision Window) → 34–37 weeks (Planned Delivery) → ≥37 weeks (Deliver). Each band shows monitoring interval and delivery threshold.
Red Flag Triggers – Immediate MDT Action Required
Regardless of gestational age, any of the following findings should prompt same-day reassessment and urgent MDT discussion. Do not wait for the next scheduled scan.
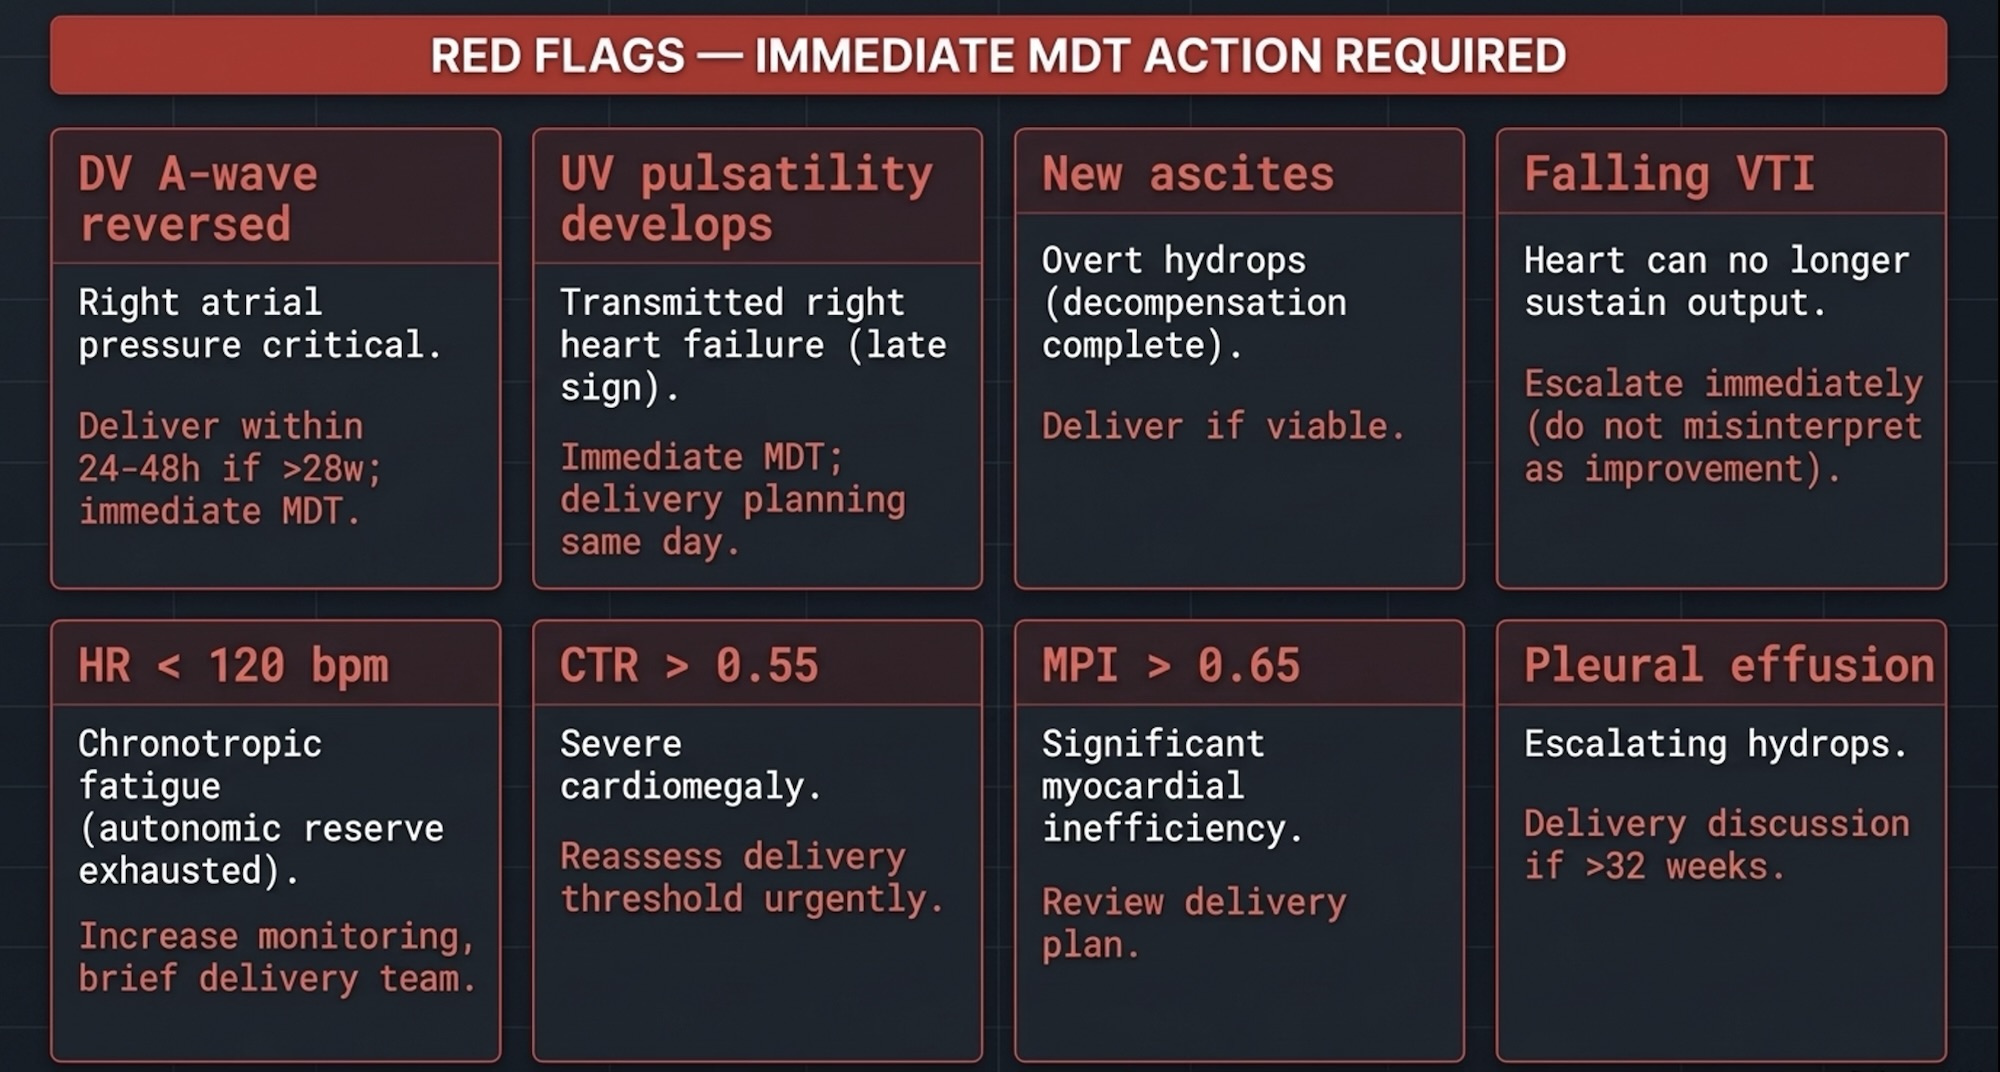
Fig 6. Eight red flag parameters in two tiers. Tier 1 (red, immediate delivery triggers): DV A-wave reversed, UV pulsatility, new ascites, falling VTI. Tier 2 (amber, escalation triggers): HR <120 bpm, CTR >>0.55, MPI >>0.65, pleural effusion appearing.
The MDT Is Not Optional
High-output fetal cardiac states cannot be managed by the fetal cardiologist alone. The decisions made at 30–34 weeks — when to deliver, where to deliver, and who needs to be in the room — require advance coordination across multiple teams. A decision made in advance is always safer than one made at 2am when the DV reverses.
| MINIMUM MDT COMPOSITION Fetal cardiologist · Maternal-fetal medicine / high-risk obstetrics · Neonatology (Level 3 NICU) · Paediatric interventional radiology or vascular surgery · Paediatric cardiac anaesthesia · Postnatal paediatric cardiology team |
The MDT must pre-agree three things in writing, before any crisis occurs:
• The target delivery gestation, so this decision is not made under pressure
• The specific triggers for earlier delivery, documented and shared with all teams
• The postnatal intervention plan, who does what, when, and what the fallback is if the neonate does not stabilise
THE DECISION FRAMEWORK
1. Calculate CCO formally at least once per case and use it as your baseline – every subsequent scan tells you if the number is rising or falling. At 32 weeks, normal is 1 litre per minute.
2. A CCO more than double the expected for gestation is significant. More than triple is serious. More than five times is extreme — regardless of how preserved the DV appears.
3. The DV A-wave is your earliest and most reliable pressure gauge. Track it at every visit. A falling heart rate in a high-output fetus is not stability – it is chronotropic fatigue.
4. A falling VTI in a previously high-output fetus is decompensation, not improvement. Treat it as urgent– always.
5. Decisions made in advance by a prepared MDT are safer than decisions made in crisis. Brief the team before the DV reverses – not after.
References
1. Huhta JC. Fetal congestive heart failure. Semin Fetal Neonatal Med. 2005;10(6):542–552.
2. Statile CJ, et al. Estimated cardiac output and cardiovascular profile score in fetuses with high cardiac output lesions. Ultrasound Obstet Gynecol. 2013;41(1):54–58.
3. Bond SJ, et al. Death due to high-output cardiac failure in fetal sacrococcygeal teratoma. J Pediatr Surg. 1990;25(12):1287–1291.
4. Schmidt KG, et al. High-output cardiac failure in fetuses with large sacrococcygeal teratoma. J Pediatr. 1989;114(6):1023–1028.
5. Baschat AA. Examination of the fetal cardiovascular system. Semin Fetal Neonatal Med. 2011;16(1):2–12.
6. Donofrio MT, et al. Diagnosis and treatment of fetal cardiac disease: a scientific statement from the American Heart Association. Circulation. 2014;129(21):2183–2242.
7. Abuhamad A, et al. Guidelines and recommendations for performance of the fetal echocardiogram. JASE. 2023.
8. Mielke G, Benda N. Cardiac output and central distribution of blood flow in the human fetus. Circulation. 2001;103(12):1662–1668.
9. Rudolph AM. Circulatory changes during gestational development of the sheep and human fetus. Pediatric Research. 2018;84:348–351.
10. Rasanen J, et al. Role of the pulmonary circulation in the distribution of human fetal cardiac output. Circulation. 1996;94(5):1068–1073.
