
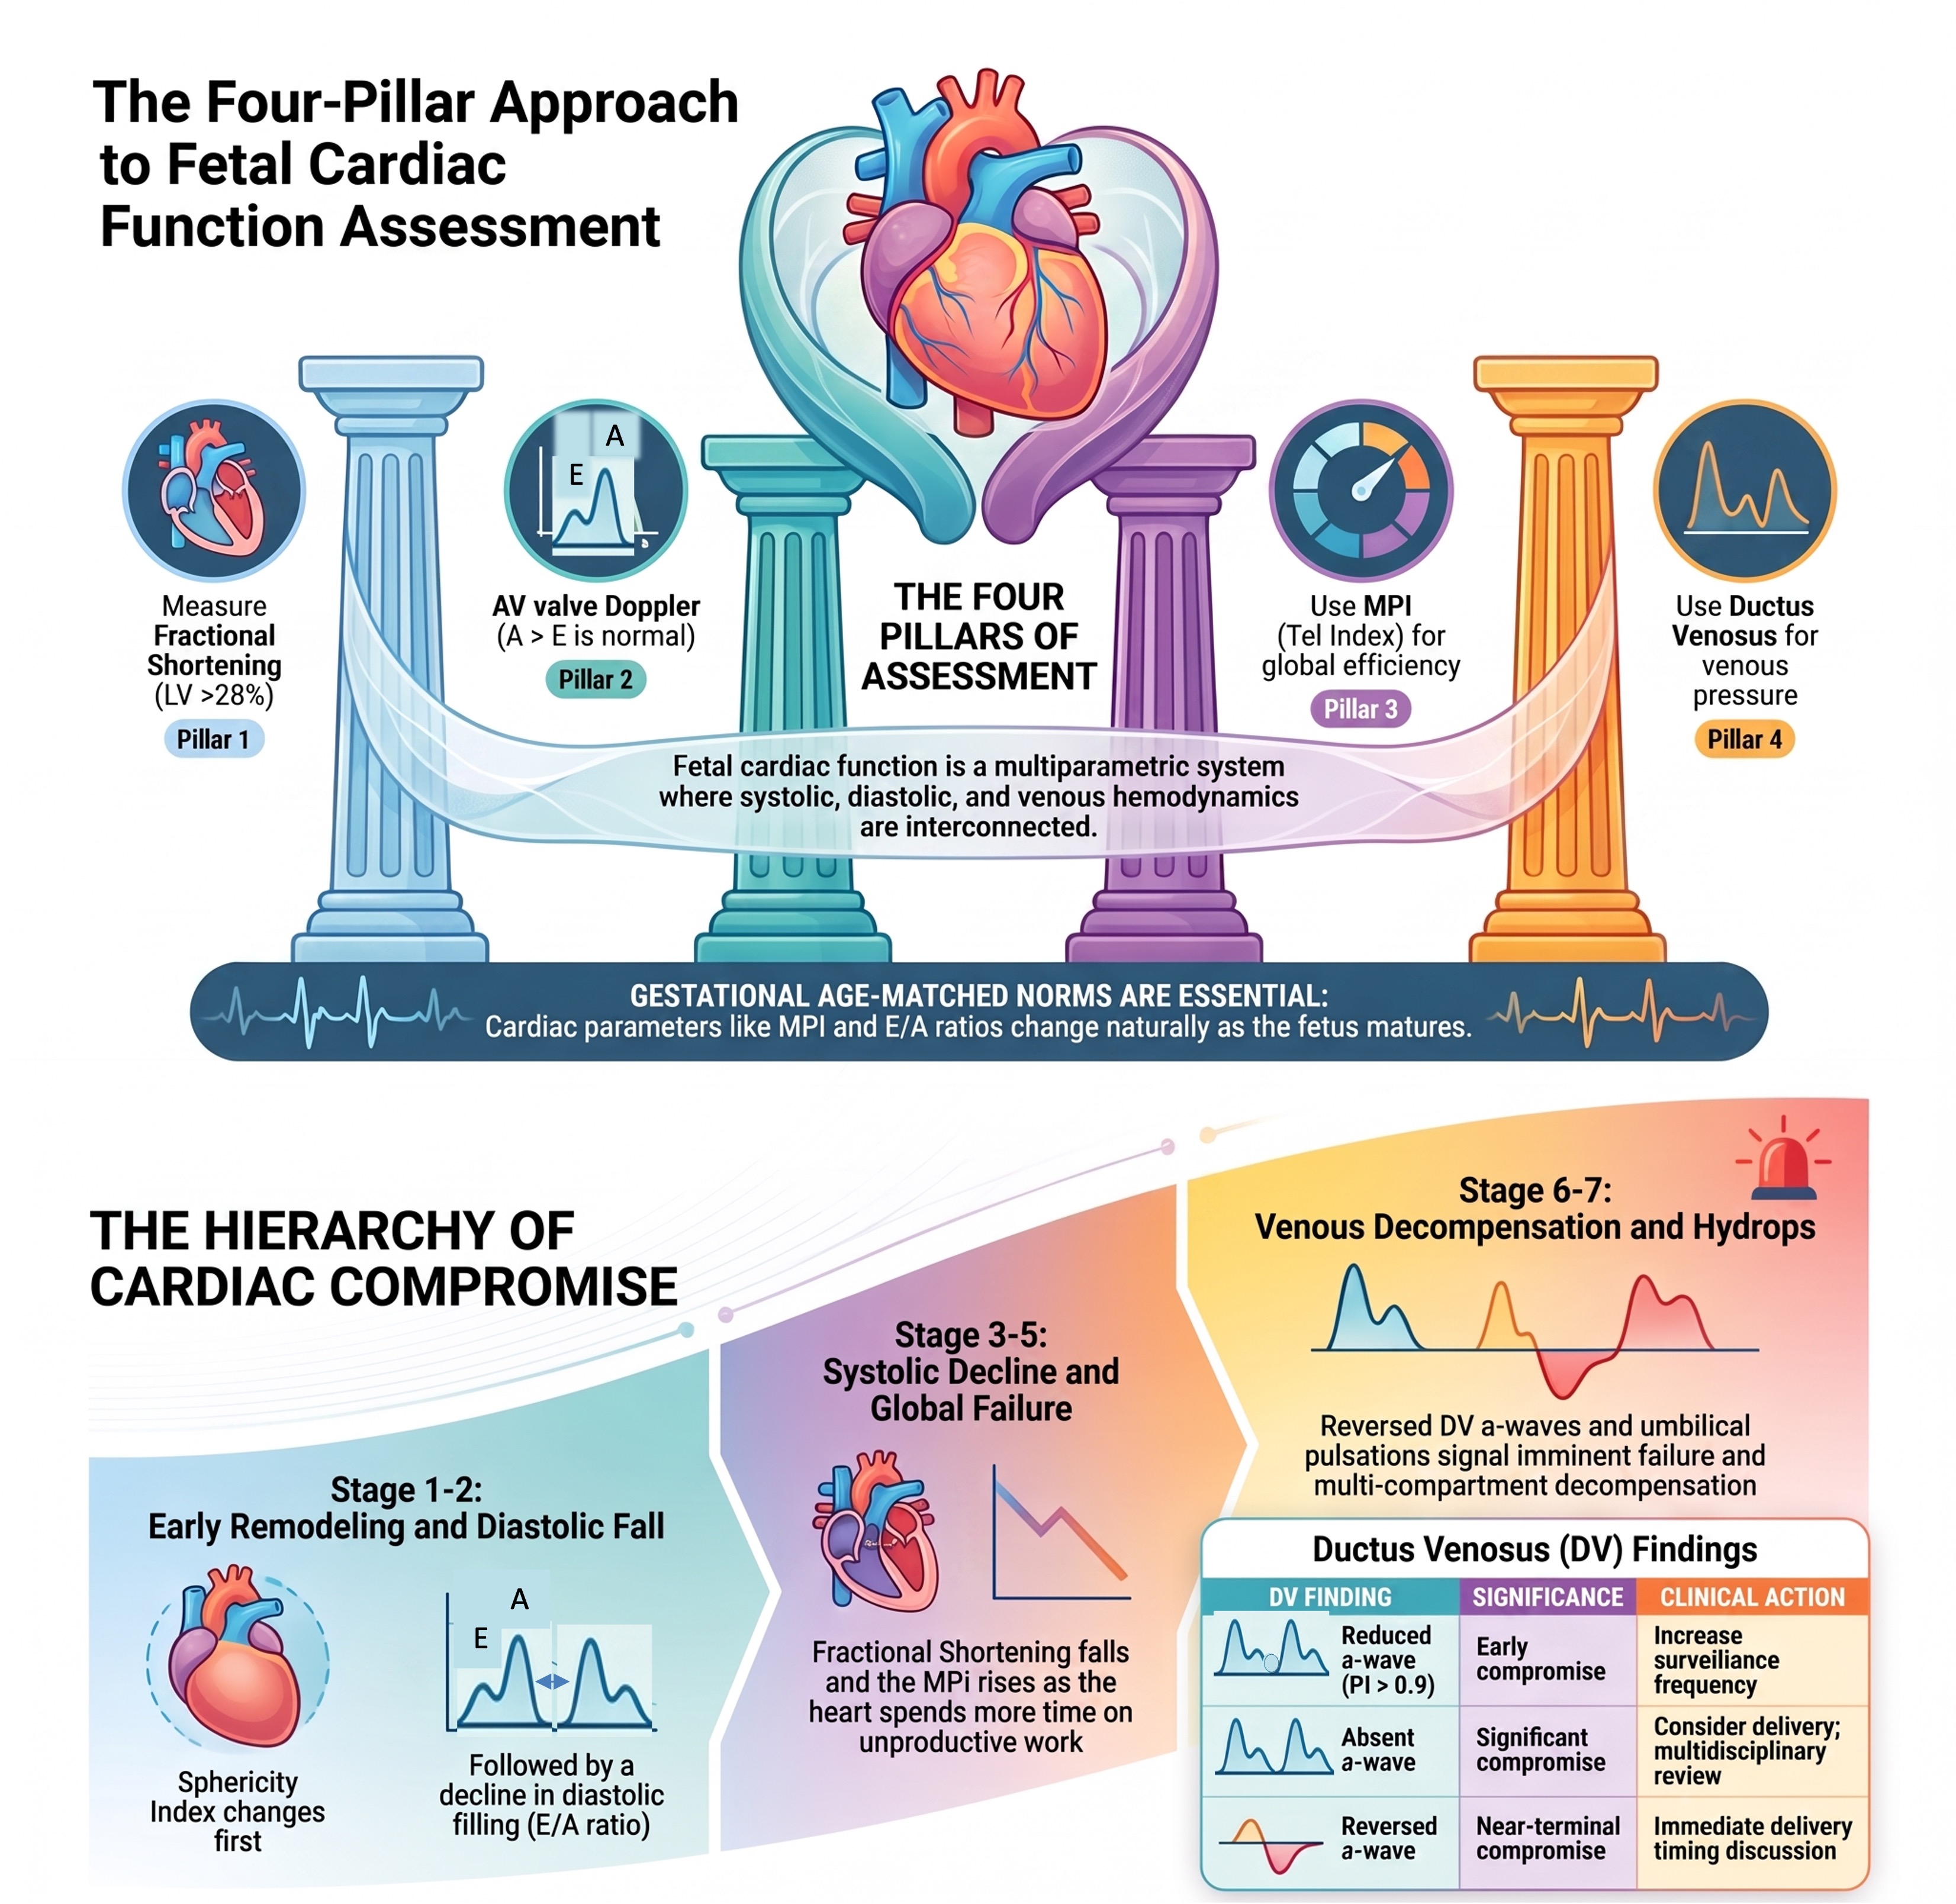
⚡ 4-Pillar Clinical Summary & Diagnostic Thresholds
Clinician Rapid Reference- MAPSE / TAPSE: Normal increases linearly with GA (TAPSE: 5–9 mm; MAPSE: 4–7 mm).
- Fractional Shortening (FS): Normal 28% – 40%.
- Fractional Area Change (FAC): Normal 35% – 45%.
- E/A Wave Ratio: Normally < 1.0 throughout gestation (0.6 at 20 wks → 0.85 at term).
- E/A Monophasic Inflow: Fused E/A wave suggests severe tachycardia, elevated filling pressures, or restricted compliance.
- Normal LV MPI: 0.36 ± 0.04 (ICT + IRT / ET).
- Pathologic Cutoff: > 0.45 indicates combined systolic & diastolic dysfunction (e.g., TTTS, FGR, Maternal DM).
- Ductus Venosus (DV): Reversed a-wave is an ominous sign of right atrial hypertension.
- Umbilical Vein (UV): Pulsatile flow = advanced right heart decompensation.
- Huhta CVP Score: ≤ 7/10 demands urgent multidisciplinary perinatology review.
Diagnostic Protocol: Fetal Cardiac Dysfunction Escalation Pathway
📊 Integrated Fetal Hemodynamic Calculator
Open in Full Window →Calculate gestational-age-matched Z-scores for cardiac dimensions, Tei Index, and Doppler indices directly below:
Frequently Asked Clinical Questions
Why is the fetal E/A inflow ratio normally less than 1.0?
In the fetus, ventricular compliance is low due to immature, non-compliant myocytes and high content of connective tissue. Consequently, passive early diastolic filling (E wave) contributes only about 30% of total stroke volume, whereas active atrial contraction (A wave) provides 70%. In post-natal life, this relationship reverses as myocardial compliance matures.
What is the single most accurate marker of impending fetal cardiovascular collapse?
A persistently reversed a-wave in the ductus venosus (DV), especially when accompanied by pulsatile flow in the umbilical vein (UV). This reflects severe transmission of elevated right atrial pressure retrograde through the venous system during atrial systole, indicating that right ventricular end-diastolic pressure has exceeded forward flow tolerance.
How does the modified MPI differ from traditional Tei Index acquisition?
The modified MPI (Hernandez-Andrade protocol) uses a single pulsed-wave Doppler sample gate positioned at the junction of the lateral mitral annulus and aortic outflow tract. It relies specifically on high-frequency valve clicks (mitral opening/closing and aortic opening/closing) to mark the boundaries of Isovolumetric Contraction Time (ICT), Isovolumetric Relaxation Time (IRT), and Ejection Time (ET), significantly reducing inter-operator variability.
A Systematic, Four-Pillar Approach
Why Fetal Cardiac Function Matters
The fetal heart is not simply a smaller version of the adult heart. It operates under entirely different haemodynamic conditions, serves a different physiological role, and responds to stress in ways that are unique to fetal life. Recognising cardiac dysfunction in the fetus before it becomes irreversible is one of the most clinically consequential skills in fetal medicine and one that remains underused.
Fetal cardiac function assessment is now a standard component of surveillance in fetal growth restriction, twin-to-twin transfusion syndrome, fetal anaemia, structural congenital heart disease, and maternal diabetes. It can detect compromise earlier than conventional biophysical markers, track deterioration in real time, and directly inform decisions about timing and mode of delivery.
Yet in most centres, fetal echocardiography stops at anatomy. Function is either not assessed or limited to a single parameter. This article sets out a structured, four-pillar approach to fetal cardiac function, one that is practical, reproducible, and grounded in current evidence.
| Core Principle The fetal heart integrates systolic performance, diastolic filling, global myocardial efficiency, and venous haemodynamics as an interconnected system. Dysfunction in one domain almost always affects the others. Assessment must be multiparametric. |

When to Assess Fetal Cardiac Function
Fetal cardiac function assessment should be part of the standard evaluation in the following clinical contexts:
- Fetal growth restriction (FGR): monitoring for cardiac remodelling and haemodynamic compromise
- Twin-to-twin transfusion syndrome (TTTS): staging, pre/post laser assessment, and surveillance of the recipient twin
- Fetal anaemia: detecting early volume overload and high-output state
- Structural congenital heart disease: assessing impact on haemodynamics and function
- Maternal diabetes: screening for hypertrophic cardiomyopathy, septal thickness, and diastolic dysfunction
- Fetal arrhythmia: assessing functional consequence
- Fetal hydrops: identifying the cardiac contribution and severity
- Monitoring after cardiac intervention (e.g. fetal pericardiocentesis, intracardiac procedures)
Note: A normal four-chamber view and outflow tract screening are prerequisites. Functional assessment is complementary to, not a replacement for, structural evaluation.
The Four-Pillar Framework
Fetal cardiac function can be systematically assessed across four domains, each targeting a different physiological component:

Each pillar is described in detail below, with normal values, technique notes, and clinical interpretation.
Pillar 1. Systolic Function
Fractional Shortening
The most widely used marker of fetal systolic function is Fractional Shortening (SF or FS), derived from M-mode measurements of ventricular cavity dimensions:
SF = (EDD − ESD) ÷ EDD × 100
Where EDD = end-diastolic dimension and ESD = end-systolic dimension, measured inner edge to inner edge at the level of the AV valve tips.
The key practical requirement is beam perpendicularity. Even a 10–15° deviation introduces a systematic overestimation of cavity dimensions and falsely reduces the calculated SF. Confirming a true short-axis appearance before switching to M-mode is non-negotiable.
| Measurement | Normal | Abnormal Threshold | Note |
| LV Fractional Shortening | > 28% | < 28% = dysfunction | LV standard threshold |
| RV Fractional Shortening | > 24% | < 24% = dysfunction | RV threshold is lower than LV |
| LV Ejection Fraction | 60–70% | < 55% = abnormal | Simpson’s method (apical 4-chamber) |
| LV Fractional Area Change | > 24% | < 24% = abnormal | Angle-independent; area-based |
| RV Fractional Area Change | > 20% | < 20% = abnormal | Preferred RV area method |
| TAPSE | 2.34–4.21 mm | Below GA-matched reference | GA-specific norms required |
| MAPSE | 2.87–5.56 mm | Below GA-matched reference | Reflects longitudinal LV function |


| Fetal Nuance — The RV Is Not the Passenger. In fetal circulation, the right ventricle contributes approximately 55–60% of combined cardiac output. The RV is equal to or slightly larger than the LV. Never apply adult-echo logic of LV dominance to the fetus; both ventricles must be assessed independently, and their thresholds differ. |
Complementary Systolic Tools
Fractional Area Change (FAC) offers an angle-independent alternative to M-mode SF, derived by tracing the endocardial border at end-diastole and end-systole in the four-chamber view. It is particularly valuable for RV assessment, where the geometry is less suited to linear M-mode measurements.
LV Ejection Fraction, calculated by Simpson’s biplane method from the apical four-chamber view, provides volumetric data that is complementary to linear shortening measurements.
Global Longitudinal Strain (GLS), assessed using speckle-tracking echocardiography, has a normal range of −20% to −25% in the fetus. It is the most sensitive marker of early subclinical dysfunction but remains a research-level tool in routine fetal practice and requires dedicated software.
Pillar 2. Diastolic Function
AV Valve Pulsed-Wave Doppler
Diastolic function reflects the ability of the ventricle to relax and fill — and in the fetus, this is the earlier and more sensitive marker of myocardial compromise. Measurement is obtained by placing the PW Doppler sample within the AV valve orifice (mitral for LV, tricuspid for RV) and recording the biphasic filling signal.
The normal fetal filling pattern shows two distinct waves:
- E wave-early passive ventricular filling. Reflects myocardial relaxation.
- A wave – late active filling driven by atrial contraction.
In the adult heart, E > A (passive filling dominates). In the fetus, A > E is normal. The fetal myocardium is inherently stiffer and less compliant; it depends heavily on atrial contraction for adequate ventricular filling. This is not pathology; it is normal fetal physiology.


| Critical Fetal Difference- A > E is a normal finding; E > A (E/A ratio > 1.0) in a fetus is a red flag for diastolic dysfunction, not a sign of healthy, adult-like filling. This distinction catches many clinicians out. The E/A ratio also increases with gestational age as the myocardium matures, so serial comparisons must account for GA. |
| Parameter | 2nd Trimester | 3rd Trimester | Interpretation |
| Mitral E/A | 0.5–0.8 | 0.7–0.9 | A > E is normal |
| Tricuspid E/A | 0.5–0.8 | 0.7–0.9 | A > E is normal |
| Abnormal threshold | E/A > 1.0 | E/A > 1.0 | Diastolic dysfunction |
Additional Diastolic Markers
Tricuspid regurgitation (TR): Any holosystolic TR signal in a structurally normal fetal heart indicates elevated RV end-diastolic pressure. Its presence alongside an abnormal DV waveform is a high-risk combination.
Inflow duration: In hypertrophic cardiomyopathies (diabetic, idiopathic), inflow duration shortens as myocardial stiffness increases and filling becomes restricted. This parameter, measured from E-wave onset to A-wave end, adds independent information beyond the E/A ratio.
Pulmonary vein Doppler: Normally biphasic with forward systolic and diastolic components. Reversal of the A-wave (during atrial contraction) is a specific marker of elevated LV end-diastolic pressure and LV diastolic dysfunction. Technically challenging but increasingly feasible with modern equipment.
Pillar 3. Global Myocardial Performance (MPI / Tei Index)
The Myocardial Performance Index (MPI), also known as the Tei Index, is a unitless ratio that captures the proportion of each cardiac cycle spent in non-ejection phases relative to ejection time:
MPI = (ICT + IRT) ÷ ET
Where ICT = isovolumetric contraction time, IRT = isovolumetric relaxation time, and ET = ejection time.
A rising MPI means the heart is spending more time doing ‘unproductive’ work (pressure building and pressure release) relative to actual ejection. It integrates both systolic and diastolic information in a single measurement, making it particularly valuable when individual parameters are borderline.


| Important — MPI Increases with Gestational Age MPI is not a fixed value across pregnancy. Normal MPI rises from approximately 0.40 at 12 weeks to 0.58 at term. A single fixed threshold applied across all gestational ages will misclassify normal fetuses in late pregnancy as abnormal. Always compare against GA-matched reference ranges. (Bligard et al. meta-analysis, cited in Patel et al. Fetal Heart Society 2026.) |
| Ventricle | Normal MPI (mid-gestation) | Abnormal Threshold | Clinical Note |
| Left ventricle | 0.36 ± 0.06 | > 0.44 | Rises in late IUGR compromise |
| Right ventricle | 0.35 ± 0.06 | > 0.43 | May rise earlier than LV-MPI |
Measurement Technique
The conventional method requires two separate Doppler recordings from the same cardiac cycle. For LV-MPI, the anatomical proximity of the LV inflow and outflow tracts allows simultaneous capture of both signals within the LV cavity, a practical advantage. For RV-MPI, separate tricuspid inflow and pulmonary outflow measurements are required.
The Tissue Doppler Imaging (TDI) method derives ICT, ET, and IRT from the myocardial annular velocity trace in a single cardiac cycle and is more reproducible where available.
- Do not measure MPI when significant AV valve regurgitation is present; it distorts all three timing intervals.
- Heart rate must be stable during measurement. Average a minimum of three consecutive cycles.
Pillar 4. Venous Doppler
Venous Doppler assessment captures the downstream haemodynamic consequences of cardiac dysfunction. Abnormalities in the venous system often appear before overt changes in systolic or diastolic function are measurable, making it a critical tool for delivery timing decisions in compromised fetuses.
Ductus Venosus: The Central Waveform
The ductus venosus (DV) waveform has a characteristic triphasic morphology: the S wave (ventricular systole), the D wave (passive diastolic filling), and the a wave (atrial contraction). In a normal fetus, all three components are forward-flowing.
DV PI = (S − a) ÷ mean velocity [Normal: < 0.9, gestation-adjusted]
The a-wave direction is the most clinically actionable element of the DV waveform. Progressive compromise follows a predictable sequence:
| DV Finding | Significance | Clinical Action |
| Forward a-wave, PI < 0.9 | Normal | Continue routine surveillance |
| Reduced a-wave, PI > 0.9 | Early compromise | Increase surveillance frequency |
| Absent a-wave | Significant compromise | Multidisciplinary review; consider delivery |
| Reversed a-wave | Near-terminal compromise | Same-day delivery timing discussion |
| UV pulsations | Imminent decompensation | Escalate immediately |


Additional Venous Vessels
Inferior Vena Cava (IVC): Similar triphasic pattern to DV. IVC PI > 0.43 indicates raised right atrial pressure. Reversed a-wave in IVC is significant but less specific than DV due to respiratory variation.
Umbilical Vein (UV): Normally completely flat and non-pulsatile. Any pulsations indicate very elevated central venous pressure, and in the context of other compromise markers, represent a pre-terminal or terminal finding.
Pulmonary Vein: The appearance of pulmonary vein A-wave reversal indicates elevated LV end-diastolic pressure and LV diastolic dysfunction. While technically challenging, it provides specific information about left-sided haemodynamics not available from the DV alone.
The Sphericity Index- Shape Changes Before Function Fails
The Sphericity Index (SI) measures the degree to which the ventricle has become globular, calculated as:
SI = Short-axis diameter ÷ Long-axis length [Normal: 0.50–0.65]
Its clinical significance lies in timing: sphericity changes before fractional shortening falls. It is, therefore, an early marker of cardiac remodelling — and one that is frequently overlooked.


| FGR Is the Most Common Clinical Context – and It Is Not Volume Overload. The mechanism of sphericity change differs fundamentally by condition. In FGR, chronic hypoxia drives pressure overload and hypertrophic remodelling; the myocardium thickens, and the ventricle becomes more globular under chronic hypoxic stress, not through dilation. The sphericity z-score falls below −1.65 before FS is abnormal, alongside MPI changes and reduced longitudinal motion. This is distinct from TTTS (direct volume overload, dilation) and anaemia (high-output biventricular dilation). Report SI as a z-score using Garcia-Otero 2020 reference ranges. |
| Condition | Mechanism | SI Pattern | Associated Findings |
| FGR | Pressure overload + hypoxic remodelling | SI z-score < −1.65 | Wall thickening, CT ratio rises, ↑MPI |
| TTTS (recipient) | Direct volume overload | Dilation, SI rises | Biventricular enlargement |
| Fetal anaemia | High-output state | Biventricular dilation | Middle cerebral artery PSV > 1.5 MoM |
| Maternal diabetes | Concentric hypertrophy | Assess wall thickness, IVS separately | Septal hypertrophy, diastolic dysfunction |
The Cardiovascular Profile (CVP) Score
The Cardiovascular Profile Score integrates five domains of fetal cardiovascular assessment into a 10-point scoring system. It is a validated tool for fetal heart failure risk stratification, applicable in CHD, cardiomyopathy, TTTS, anaemia, and FGR with cardiac involvement.

| CVP Score Interpretation Maximum score = 10 (entirely normal). CVP ≤ 7 signals high risk of adverse outcome and warrants multidisciplinary review. The score does not replace clinical judgement, but provides a structured audit of cardiovascular burden. Serial scoring, tracking the trajectory over days to weeks, is often more informative than any single value. |
A Systematic Scan Protocol
Performing fetal cardiac function assessment in a consistent sequence reduces the risk of omitting parameters and allows serial studies to be directly comparable. The following eight-step protocol is adapted from published literature:

Step 1 — Heart rate and rhythm
Normal range: 134–170 bpm (Mitchell et al., centile-based). Confirm regular rhythm. Any arrhythmia invalidates timing-based measurements — address before proceeding.
Step 2 — Cardiac size and shape
CT ratio (normal < 0.35) and Sphericity Index (normal 0.50–0.65). Use GA-matched z-scores for sphericity.
Step 3 — M-mode Fractional Shortening — both ventricles separately
LV-SF normal > 28%; RV-SF normal > 24%. Confirm beam perpendicularity.
Step 4 — AV valve PW Doppler — diastolic function
Mitral and tricuspid inflows. E/A ratio and inflow duration. Check for holosystolic TR.
Step 5 — MPI (if borderline or high clinical suspicion)
LV-MPI and RV-MPI. Use GA-matched reference ranges. TDI method preferred where available.
Step 6 — Venous Doppler
DV PI and a-wave direction. UV pulsatility. IVC if technically feasible.
Step 7 — Tissue Doppler Imaging (where available)
S’, E’, A’ at tricuspid and mitral annuli. GA-matched reference ranges. Most sensitive early marker of subclinical dysfunction.
Step 8 — Structural correlation
Pericardial effusion (> 2 mm = abnormal). Ascites, skin oedema, pleural effusion. Two or more sites = hydrops.
The Hierarchy of Cardiac Compromise
In IUGR and other chronic fetal conditions, cardiac compromise tends to follow a predictable sequence. Knowing this hierarchy allows the clinician to interpret each new finding in the context of the overall trajectory:
| Stage | Finding | Significance |
| 1 | Sphericity Index rises (shape change) | Earliest & precedes measurable function change |
| 2 | E/A ratio approaches 1.0; diastolic function falls | Early dysfunction |
| 3 | FS falls; global function deteriorates | Moderate compromise |
| 4 | MPI rises (global dysfunction) | Systolic + diastolic integration failing |
| 5 | DV PI rises; absent DV a-wave | Venous pressure rising |
| 6 | Reversed DV a-wave; UV pulsations | Near-terminal |
| 7 | Hydrops | Multi-compartment decompensation |

Conclusion
Fetal cardiac function assessment is not a specialist add-on; it is a clinical skill with direct implications for management and outcome. The four-pillar framework- systolic, diastolic, global performance, and venous- provides a structured, reproducible approach that can be integrated into any fetal medicine practice.
Three principles should guide practice:
- Assess both ventricles independently and in parallel. The fetal RV matters as much as the LV.
- Use GA-matched reference ranges for every parameter. Normal values change across pregnancy, and a fixed cutoff applied at any gestational age will mislead.
- Integrate findings across pillars. A borderline FS with a rising MPI and a reduced DV a-wave is not borderline; it is a fetus in progressive compromise requiring urgent reassessment.

References.
1. Crispi F, Gratacos E. Fetal cardiac function: technical considerations and potential research and clinical applications. Fetal Diagn Ther. 2012;32(1-2):47–64.
2. Crispi F, et al. Ultrasound assessment of fetal cardiac function. Australas J Ultrasound Med. 2013;16(4):158–167.
3. Crispi F, et al. Main patterns of fetal cardiac remodelling. Fetal Diagn Ther. 2020;47:337–344.
4. Bijnens B, et al. Myocardial motion and deformation: what does it tell us and how does it relate to function? Fetal Diagn Ther. 2012;32(1-2):5–16.
5. Hernandez-Andrade E, et al. Modified myocardial performance index with the use of a new Doppler index to evaluate fetal left ventricular function. Ultrasound Obstet Gynecol. 2005;26:227–232.
6. Garcia-Otero L, et al. Reference ranges for fetal cardiac, ventricular and atrial relative size, sphericity, ventricular dominance, wall asymmetry and relative wall thickness from 18 to 41 weeks of gestation. Ultrasound Obstet Gynecol. 2020. doi: 10.1002/uog.23127.
7. Soveral I, et al. Cardiac filling and ejection time fractions by pulsed Doppler: fetal nomograms and potential clinical application. Ultrasound Obstet Gynecol. 2020. doi: 10.1002/uog.22152.
8. Guirado L, et al. Nomograms of fetal right ventricular fractional area change by 2D echocardiography. Fetal Diagn Ther. 2020;47:399–410.
9. Mitchell JL, et al. Normal fetal heart rate reference ranges. Ultrasound Obstet Gynecol. 1994.
10. Donofrio MT, et al. Diagnosis and treatment of fetal cardiac disease: a scientific statement from the American Heart Association. Circulation. 2014;129:2183–2242.
11. ISUOG Practice Guidelines: Cardiac screening examination of the fetus. Ultrasound Obstet Gynecol. 2023.
12. Patel SR, et al. How to assess ventricular function by fetal echocardiography: expert guidance from the Fetal Heart Society. Ultrasound Obstet Gynecol. 2026;68:140–151. doi: 10.1002/uog.70276.
13. Bligard KH, et al. Meta-analysis of normative fetal MPI/Tei Index values across gestational age. Ultrasound Obstet Gynecol. 2024. [Cited in Patel et al. 2026]
Fetal Cardiac Function Assessment: Dr. Mridul Agarwal; July 2026. Educational content. For clinical decision-making, apply locally validated reference ranges.