
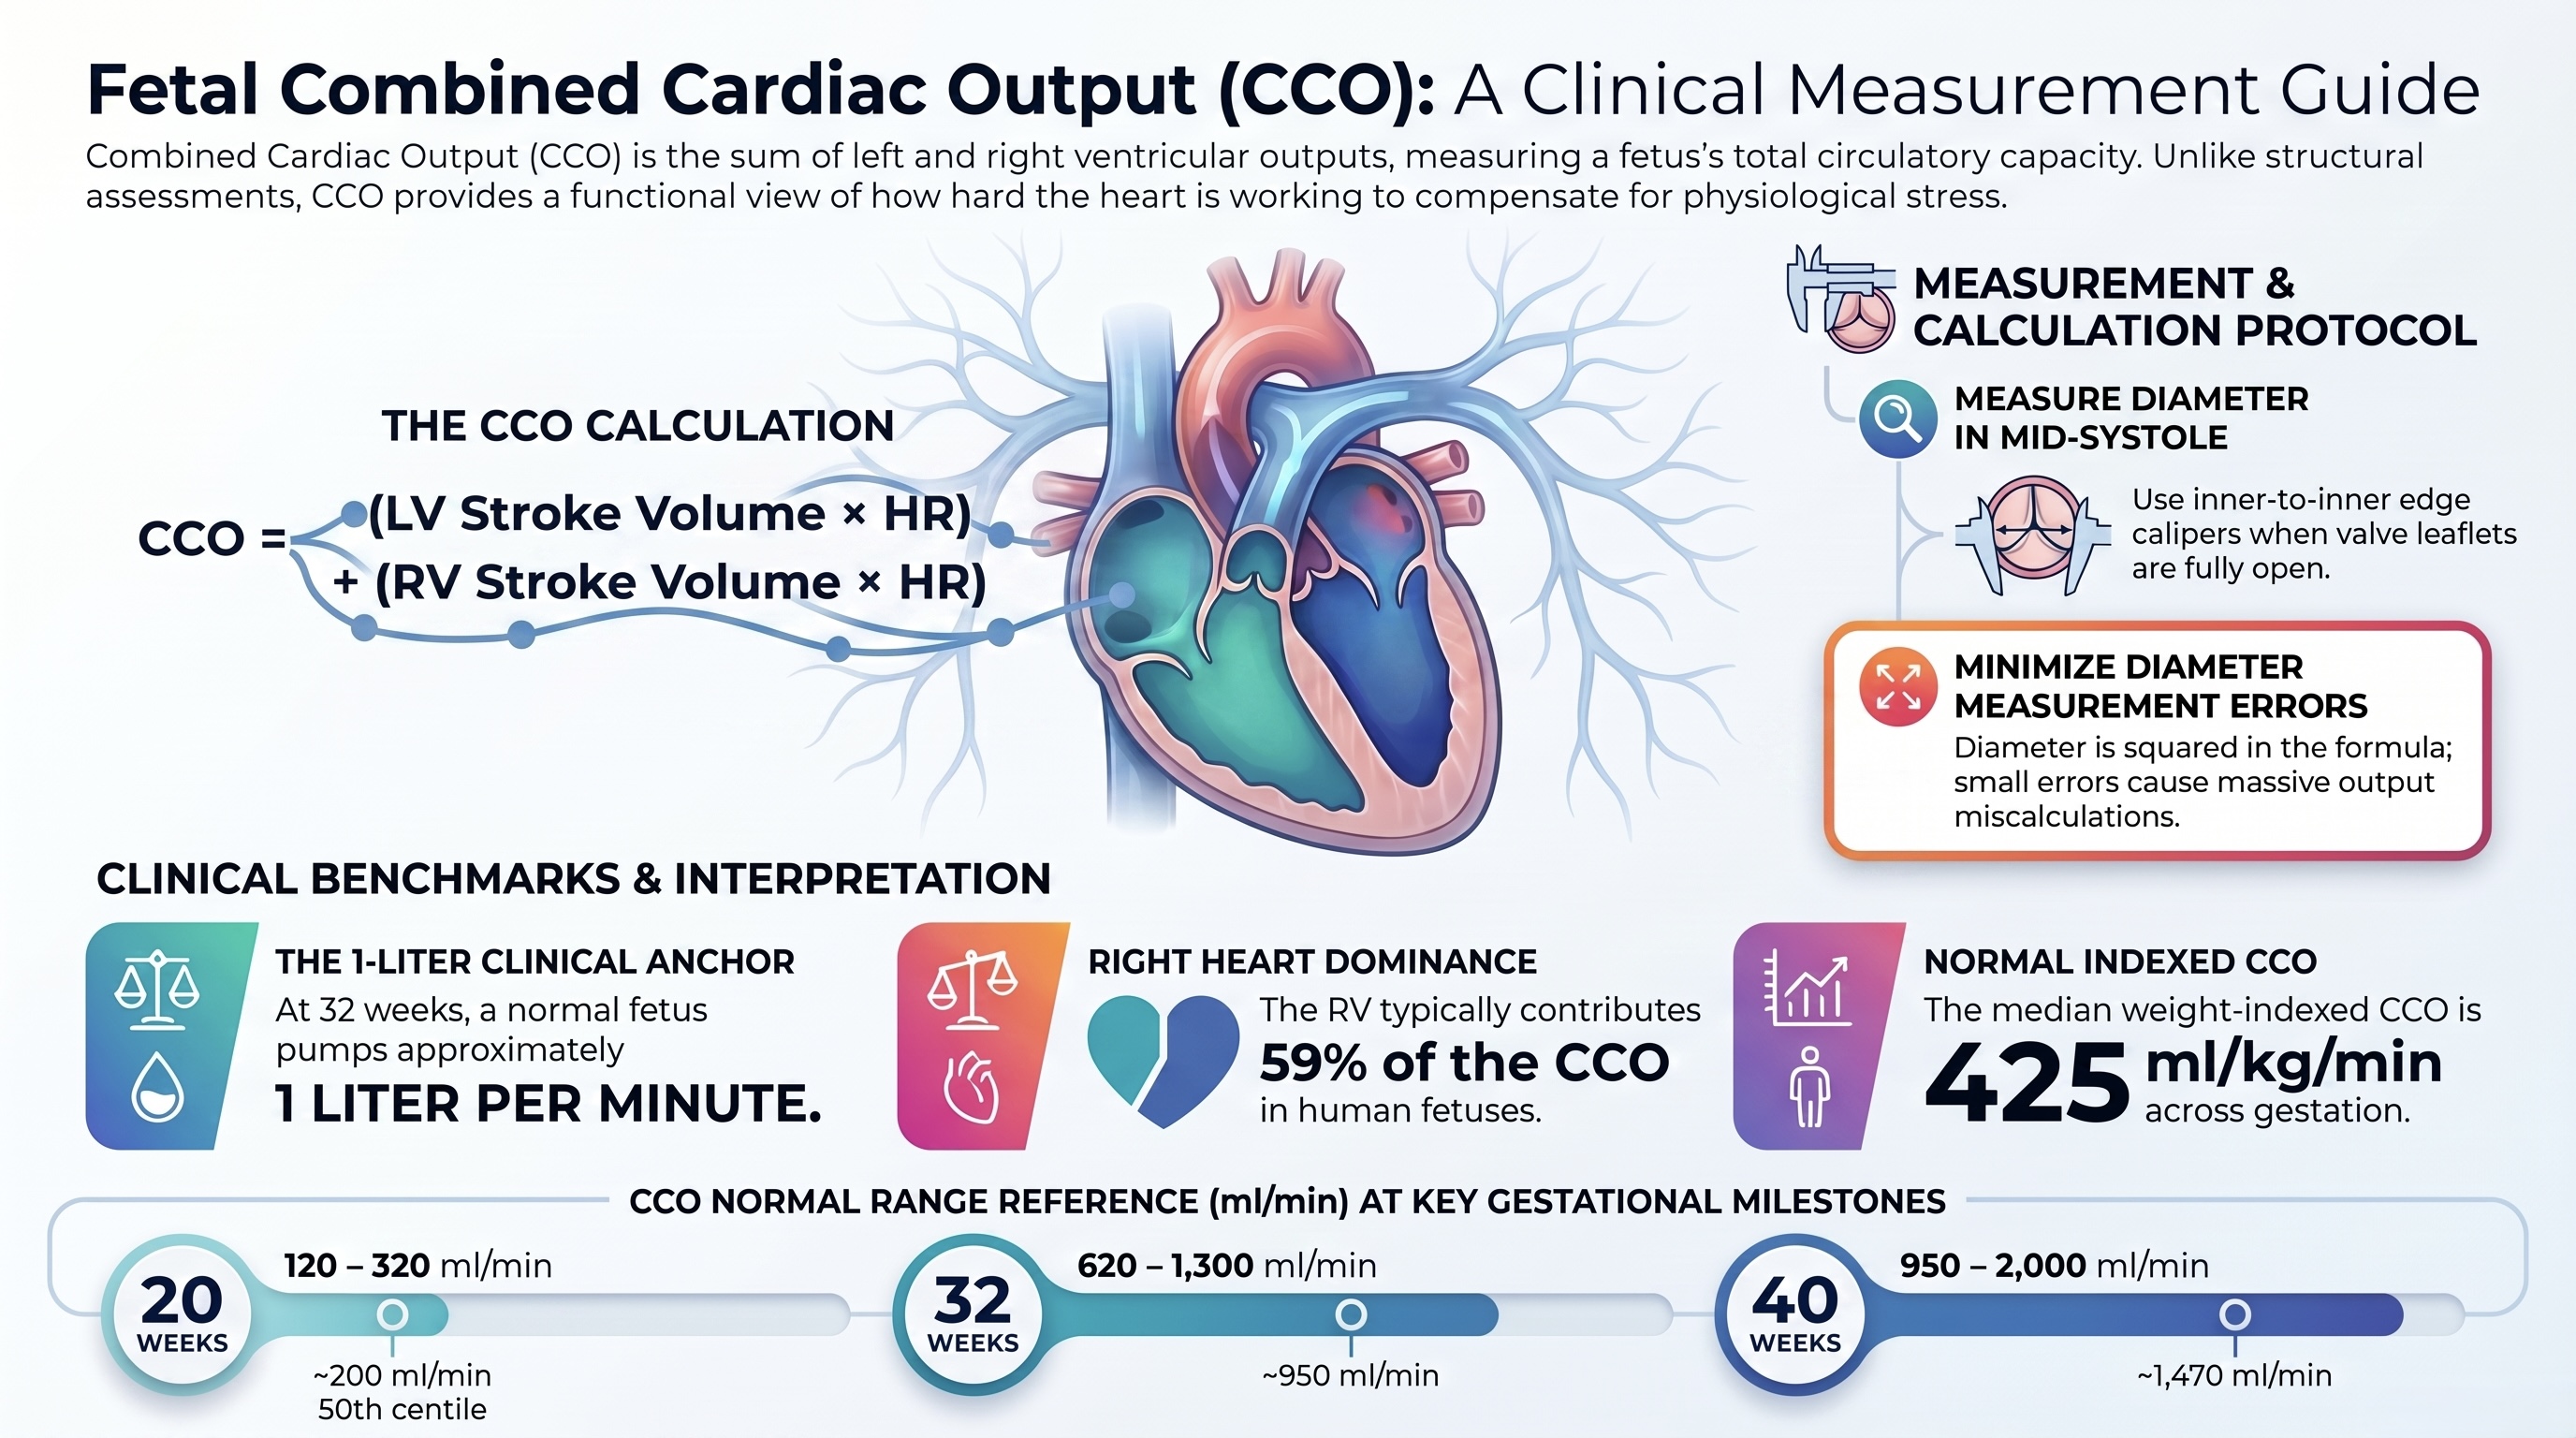
Measurement, Calculation, and Normal Reference Values
Why Measure Combined Cardiac Output?
Most fetal echocardiography focuses on structure — chambers, valves, great arteries. Cardiac output assessment sits in a different domain: it is functional haemodynamics. Yet it is precisely this measurement that tells you how hard the fetal heart is working, whether it is compensating for a physiological stress, and when compensation is beginning to fail.

The Formula
CCO is calculated using standard Doppler echocardiography. The formula is the same for both ventricles:

Each component of this formula contributes independently to the final output:
- Valve diameter determines the cross-sectional area through which blood flows
- VTI (velocity-time integral) represents the distance a column of blood travels per beat, the area under the Doppler envelope
- Heart rate converts per-beat stroke volume into per-minute flow
The critical implication: when the diameter doubles, area quadruples. A small error in diameter measurement produces a large error in stroke volume. This is the single most important source of CCO measurement error.
How to Measure: Step by Step
Step 1. Measure the Aortic Valve Diameter (LVOT)
- Obtain the parasternal long axis view of the left ventricle
- Freeze the image in mid-systole — when the aortic leaflets are fully open
- Place callipers at the inner edge of the aortic annulus, perpendicular to the direction of flow
- Measure diameter in centimetres to two decimal places
- Average three measurements from three separate cardiac cycles

| LVOT Diameter Measurement: Parasternal long axis view showing correct calliper placement at the aortic annulus in mid-systole, with aortic valve open. |
Step 2. Trace the Aortic VTI
- Apply pulsed-wave Doppler at the level of the aortic annulus — in the five-chamber or apical long axis view
- Sample volume should be 2–3 mm, placed just below the aortic valve
- Angle of insonation should be <20° to the direction of flow, correct if needed
- Obtain a clean spectral envelope with a well-defined outer border
- Trace the outer edge of the envelope from onset to end of forward flow
- Measure VTI in centimetres

| Aortic VTI Tracing: Pulsed-wave Doppler at LVOT showing correct sample volume placement and envelope tracing. |
Step 3. Measure the Pulmonary Valve Diameter (RVOT)
- Obtain the parasternal short axis view or the right ventricular outflow tract view
- Freeze in mid-systole with pulmonary leaflets open
- Measure inner diameter at the annular level, not the main pulmonary artery
- The pulmonary annulus is slightly larger than the aortic annulus in normal fetuses; do not assume equality
Step 4. Trace the Pulmonary VTI
- Apply pulsed-wave Doppler at the pulmonary annulus level
- Trace the outer envelope as for the aortic VTI
- Pulmonary VTI is typically slightly higher than aortic VTI, reflecting right heart dominance
Step 5. Calculate
Using the formula above for each ventricle, then sum the two outputs. Most modern echo machines will calculate stroke volume automatically once diameter and VTI are entered. Always verify the machine’s calculation against a manual check.
Common Measurement Errors

Normal Reference Values
Absolute CCO by Gestational Age
The following table is derived from Mielke and Benda (Circulation, 2001), the largest prospective Doppler-based normative dataset in human fetuses, covering 222 pregnancies from 13 to 41 weeks.


Source: Mielke G, Benda N. Cardiac output and central distribution of blood flow in the human fetus. Circulation. 2001;103(12):1662–8. Values at 34 weeks corroborated by Mao et al. (n=506): LV 391 ml/min, RV 573 ml/min, CCO 964 ml/min.
Indexed CCO (Weight-Corrected)
When comparing across gestational ages or between fetuses of different size, weight-indexed values are more informative than absolute values.

| CLINICAL ANCHOR At 32 weeks, a normal fetus pumps approximately 1 litre per minute. This is the single most useful number to hold in memory at the echo machine. Double that is significant. Triple is serious. Five times is extreme. |
Normal VTI and Stroke Volume by Gestation
VTI and stroke volume are rarely reported in isolation in fetal studies — most papers report output directly. The following values are derived from published normative Doppler data and validated CCO studies.

| KEY POINT — INTERPRETING VTI ON SCREEN Normal aortic VTI at 32 weeks is approximately 12–15 cm. A VTI of 25 cm at 32 weeks is roughly double normal- indicating significant stroke volume augmentation. A VTI of 30 cm is triple normal. You do not need to complete the full CCO calculation to recognise this as abnormal – the VTI alone tells you. |
Distribution of CCO in the Human Fetus
Understanding where CCO goes is as important as knowing the total. The following data represents human fetal Doppler and MRI measurements — not ovine data.


| Flow diagram showing CVO distribution as % across all destinations listed in the table above. Source all values from human Doppler / MRI data. Note the 23% pulmonary fraction and the decreasing placental fraction near term. Distinguish clearly from Rudolph sheep data. |

When to Measure CCO

The ASE 2023 fetal echocardiography guidelines recommend quantitative CCO measurement when cardiac function or output is suspected to be abnormal. This includes:
- Suspected high-output states: AV malformations, sacrococcygeal teratoma, chorioangioma, severe anaemia, TTTS recipient twin
- Suspected low-output states: severe CHD, cardiomyopathy, cardiac failure from any cause
- Serial monitoring of any condition affecting fetal cardiac workload
- Assessment of hydrops — to quantify the cardiac contribution
- Baseline assessment at diagnosis of any haemodynamically significant lesion
CCO should not be measured in isolation. It is most informative when paired with:
- Ductus venosus A-wave — venous pressure surrogate
- Myocardial Performance Index (MPI) — global myocardial efficiency
- Cardiothoracic area ratio — structural adaptation
- Hydrops assessment — serous fluid inventory
References
1. Mielke G, Benda N. Cardiac output and central distribution of blood flow in the human fetus. Circulation. 2001;103(12):1662–1668.
2. Mao YK, et al. Z-score reference ranges for pulsed-wave Doppler indices of the cardiac outflow tracts in normal fetuses. Ultrasound Obstet Gynecol. 2019.
3. Rasanen J, et al. Role of the pulmonary circulation in the distribution of human fetal cardiac output during the second half of pregnancy. Circulation. 1996;94(5):1068–1073.
4. Rudolph AM. Circulatory changes during gestational development of the sheep and human fetus. Pediatric Research. 2018;84:348–351.
5. Donofrio MT, et al. Diagnosis and treatment of fetal cardiac disease: a scientific statement from the American Heart Association. Circulation. 2014.
6. Abuhamad A, et al. Guidelines and recommendations for performance of the fetal echocardiogram: an update from the American Society of Echocardiography. JASE. 2023.
Compute gestational Z-scores for valvar annular dimensions, modified Tei index (Mod-MPI), and systolic excursion (TAPSE/MAPSE) directly in our online suite.
Launch Fetal Function & Z-Score Calculator →