
Preparing for parenthood involves prenatal screenings, which may unveil the possibility of chromosomal abnormalities like Down syndrome, or trisomy 21. In the second trimester, certain sonographic markers aid in assessing this risk. In this post, we delve into the statistical techniques that transform ultrasound observations into precise risk assessments.
Soft markers, identified during the anatomy scan at 18-20 weeks of gestation, offer crucial insights into the likelihood of chromosomal abnormalities such as Down syndrome (Agathokleous et al., 2013). These markers indicate a heightened risk for fetal aneuploidy or specific non-chromosomal abnormalities.
During fetal echocardiography, the identification of soft markers like Intracardiac Echogenic Foci and an Aberrant Subclavian Artery prompts further examination for trisomy 21. Assessing the altered risk level post-marker identification necessitates statistical analysis integrating clinical and ultrasound findings. This calculation, pivotal in the second trimester, aids in determining the need for additional genetic screening.
Step-by-Step Evaluation Process
- Clinical Assessment: Begin with a comprehensive review of the patient’s medical history, age, and any previous screenings or test results.
- Ultrasound Scan & Fetal Echo: Conduct a detailed second-trimester ultrasound to observe any soft markers and fetal echo for Intracardiac Echogenic Foci and Aberrant Subclavian Artery.
- Marker Identification: If soft markers are identified, record their presence and note any additional sonographic abnormalities.
- Risk Calculation: Utilize statistical methods to integrate the sonographic findings with clinical data. This might involve the use of likelihood ratios, which modify the pre-test probability (initial risk based on maternal age and other factors) to generate an adjusted risk for trisomy 21.
- Interpretation of Results: Compare the new risk assessment against established clinical thresholds to determine the need for further genetic testing, such as noninvasive prenatal testing or invasive procedures like amniocentesis.
Understanding Statistics and Likelihood Ratios (LR)
Likelihood ratios
- Pre-Test Probability Determination: Begin with the pre-test probability of Down syndrome, which is typically based on factors such as maternal age and results from first-trimester screenings.
- Soft Marker Identification: During the second-trimester scan, observe for soft markers associated with Down syndrome, such as Intracardiac Echogenic Foci or Aberrant Subclavian Artery.
- Likelihood Ratios Application:
- Positive LR (+LR): If a soft marker for Down syndrome is present, the positive LR (the likelihood that a positive test result would be expected in a fetus with Down syndrome compared to one without) is used to adjust the pre-test probability upwards.
- Negative LR (−LR): Conversely, if the marker is absent, the negative LR (the likelihood that a negative test result would be expected in a fetus with Down syndrome compared to one without) is used to adjust the pre-test probability downwards.
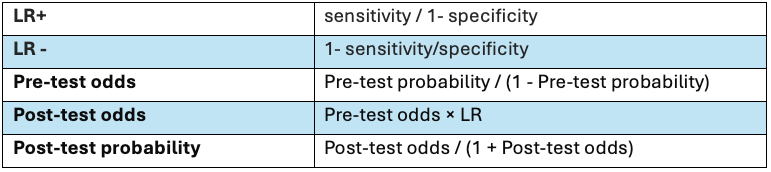
- Risk Probability Calculation: Multiply the pre-test probability (expressed as odds) by the LR to calculate the post-test odds. Convert these odds back to probability for a more intuitive understanding of the risk.
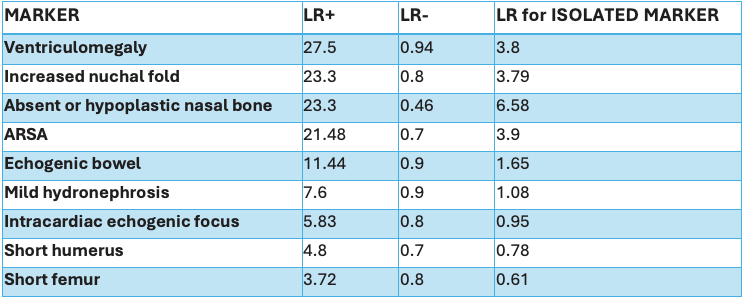
LR values are taken from the study “Meta‐analysis of second‐trimester markers for trisomy 21” by Maria Agathokleous et al.” (from pooled data from 48 studies). Estimation of Combined LR: The LR+ of all the markers present and LR- of all the markers absent are multiplied to find a final LR for the calculation. LR for the single isolated marker is calculated and provided in the table in descending order.
To calculate the post-test probability using the LR+ with given pre-test probability we follow these steps:
- Convert the pre-test probability to odds.
- Calculate the post-test odds using the LR+.
- Convert the post-test odds back to probability.
Example
Take an example of a case with given 1/1000 risk of trisomy after first-trimester screening and on USG at 18 weeks found to have Echogenic foci in LV (ICEF) and referred for fetal echo. In Fetal echo, there is an additional finding of aberrant right subclavian artery(ARSA).
So LR for isolated ICEF is near one that does not change probability at all. LR for isolated ARSA is 3.9 but ARSA along with ICEF is 28.69 from the table.
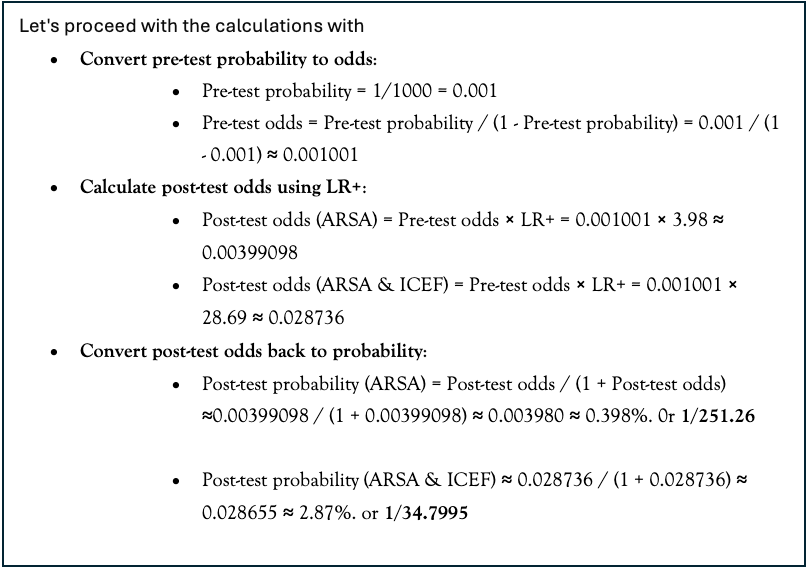
So isolated ICEF does not have any risk factors, the isolated ARSA changes the risk to 1/251 from 1/1000, but the presence of ICEF with ARSA changes the risk to 1/34.7. Thus, a soft marker which may not have a significant impact as an isolated marker, has good statistical significance in combination with other soft markers.
A simplified way to this lengthy calculation would be directly dividing Pre-risk with LR, which will give similar numbers, for example for isolated ARSA in the above case because baseline risk is very low for statistical calculation.
Post test probability = 1000/ 3.98= 251.256 or 1/251.6 risk.
When to advise further testing?
In prenatal care, healthcare providers often consider a risk value above 1 in 250 (or 0.4%) as a threshold for recommending invasive procedures like amniocentesis, and a similar range of 1 in 250 to 1 in 300 for Non-Invasive Prenatal Testing (NIPT). These thresholds are indicative of a higher likelihood of detecting chromosomal abnormalities, particularly Down syndrome (trisomy 21). However, it’s important to note that the decision to proceed with diagnostic testing is not solely based on a specific risk value. Individual risk factors, such as maternal age and previous pregnancy history, along with patient preferences, play a significant role in the decision-making process.
NIPT, in particular, is often offered when the risk of chromosomal abnormalities is perceived to be higher than the background risk in the general population. Unlike invasive procedures like amniocentesis, NIPT carries no procedural risk, allowing for more liberal risk thresholds. This approach enables healthcare providers to provide comprehensive care tailored to each patient’s unique circumstances, ensuring informed decision-making and personalized management plans.
Conclusion
The judicious use of sonographic markers in the second trimester, when combined with a solid statistical framework, plays a pivotal role in prenatal Down syndrome risk assessment. By carefully applying likelihood ratios to integrate clinical and sonographic data, healthcare providers can present expectant parents with a more accurate estimation of risk. This informed approach paves the way for meaningful discussions on the necessity of further confirmatory testing. It is the responsibility of healthcare professionals to guide patients through their options with compassion and clarity, ensuring that decisions are made with the best available evidence and the individual’s circumstances in mind. As medical practices evolve with ongoing research and technological advancements, staying abreast of the latest guidelines and best practices is critical for providing optimal prenatal care and support.
